Nineteen Sixty-four is a research blog for the Center for Applied Research in the Apostolate (CARA) at Georgetown University edited by Mark M. Gray. CARA is a non-profit research center that conducts social scientific studies about the Catholic Church. Founded in 1964, CARA has three major dimensions to its mission: to increase the Catholic Church's self understanding; to serve the applied research needs of Church decision-makers; and to advance scholarly research on religion, particularly Catholicism. Follow CARA on Twitter at: caracatholic.

8.12.2022

Updated Catholic Populations for 2022

A decade ago, we posted about a “micro-scoping view of the Catholic population.” It has been enough time that we felt we needed to update this.

Both the General Social Survey (GSS) and Gallup estimate that 22% of U.S. adults self-identify as Catholic. As of July 1, 2022, the Census Bureau estimated that there were 332,838,183 residents of the United States and that 77.8% of them are ages 18 and older. Applying these two percentages to that population total we estimate that there are 56,968,583 Catholic adults in the country. If we assume the children of some of these adults have similar religious affiliations to their parents then we expect that there is likely 73,224,400 Catholics of any age in the country.

Some might note that you can’t be unbaptized and there are also those who no longer self-identify as Catholics. We can use the General Social Survey to estimate how sizeable this population is. A total of 33.9% of U.S. adults indicate they were raised Catholic. With 22% continuing to self-identify as Catholic that means 11.9% of U.S. adults formerly self-identified as Catholic but no longer do so. This is equivalent to 30,814,825 adults who were presumably baptized but no longer consider themselves Catholic (we cannot estimate the number of minors who have left the faith and are now former Catholics). That also means the total population of people baptized Catholics in the country is 87,783,408 (some were baptized outside the U.S. and later immigrated here). 


The next group you can zero in on are what we call “parish-connected” Catholics. These are self-identified Catholics who attend Mass with some frequency and most register with a parish. At Christmas and Easter there are approximately 52,721,568 Catholics who attend Mass in 2022 (this total includes those who attend more often). That is equivalent to about 3,180 people in the typical parish. A total of 41,957,581 are in households registered with a Catholic parish. Of the aforementioned Mass attenders at Christmas and Easter, 32,950,980 attends Mass at least once a month (this total includes those who attend more often).

The next group is the “very active and involved” Catholics encompassing 17,573,856 weekly Mass attenders and 8,944,068 who are “very involved” with their parish outside of Mass. Respectively that encompasses 1,060 weekly attenders in the typical parish with 540 being “very active” outside of Mass.

The final group includes those professionals involved in ministry (albeit not all in parishes). This includes 141,382 people who are priests, vowed religious, permanent deacons, and lay ecclesial ministers. Technically, that would mean there are 2.1 priests per parish with a total population of 34,923. However, some are religious priests who are less likely to be involved in parish ministry than diocesan priests. Among both these groups there is a significant number who are retired and no longer active in ministry today. When you break things down to active diocesan priests per parish it comes out to about 1.0. Yet these priests are not evenly distributed across dioceses so some do not have enough diocesan priests for there to be one priest assigned to each parish.

Using CARA Catholic Polls (CCP) we can estimate other populations estimates that may be of interest. Some 58.3 million Catholics were born in the United States and 14.9 million were born elsewhere. A total of 48.0 million adult Catholics received the Sacrament of Confirmation. Among Catholic adults, 23.0 million attended a Catholic school at some point when they were young (according to NCEA, 1.345 million Catholic minors are currently attending Catholic schools). There are 4.4 million self-identified Catholics who were not raised Catholic who later converted to Catholicism.

The largest generation of Catholics, currently, are Millennials (19.8 million) followed by Generation X (18.3 million), and then Baby Boomers (15.8 million). A total of 33.7 million Catholic adults are married or widowed, 8.2 million are divorced or separated, and 15.0 million have never married (of which 11.4 million are Millennials).

There are 16.2 million Catholic Democrats compared to 12.4 million Republicans. Yet, there are more Catholic conservatives than liberals (19.3 million compared to 13.7 million). Most adult Catholics are not affiliated with a political party (25.9 million) and 23.9 million consider themselves to be “middle of the road” when it comes to political ideology.

Correction 8/10/2022: A former version of this blog included an estimate for minors who had left the faith. This led to larger estimates of "former Catholics" than is likely. However, we cannot assume the share of minors who have left is similar to the share of adults. Presumably this is less common among children and teenagers.
8.02.2022

Are Religious Sisters Headed for Extinction in the 2040s? (Spoiler… No)

Last Week ABC News published a story entitled “America’s nun population in steep decline” with five authors. The story’s lede starts by noting that young adults are becoming less religious. It highlights that fewer are identifying as Christian, including identifying as Catholic. As we’ve shown before, the decline in Christian affiliation is much steeper than in Catholic affiliation, which has been quite stable by comparison. Also many young adult Catholics are increasingly religiously active in unconventional ways.

The story then refers to studies that were profiled by a Catholic news source about the age distribution of religious sisters. The ABC News story concludes that the average age of sisters is 80. Yet, I don’t believe either of the studies cited indicate this. The survey of membership survey of the Council of Major Superiors of Women Religious (CMSWR) found the average age of its members was 57. The second report, by CARA, reviews population trends and a survey of sisters. A 2009 survey cited in that report includes an age distribution for all sisters but no average age is given.

Then this paragraph appears in the story: “In 2022, there were reportedly fewer than 42,000 nuns in America, which is a 76% decline over 50 years. At the rate sisters are disappearing, one estimate said that there will be fewer than 1,000 nuns left in the United States by 2042, according to the Center for Applied Research in the Apostolate.” This links to a Pew Research Center report that links to CARA’s Frequently Requested Statistics.

CARA has not projected that there will be fewer than 1,000 nuns in the United States in 20 years. If one took the data from our frequently requested statistics, from 1970 to 2021, and applied a rate of change and assumed “if current trends continue” then the assumption in the aforementioned paragraph might look like the best future estimate. But again, CARA did not say this and furthermore it is far from the best future estimate.

In 2014, the Conrad N. Hilton Foundation commissioned the CARA to conduct an annual survey of women and men who enter religious life each year in a religious congregation, province, or monastery based in the United States. CARA surveys religious institutes annually asking for a list of new entrants. We then survey these men and women entering religious life annually. In 2021, for example, 136 women entered religious life. Their average age was 28 (median age of 25). Between 2015 and 2021, 1,279 women entered religious life and had, at the time of entry, a similar age profile to those entering in 2021. The average size of an annual entrance class during this period is 183.

The steep decline in the number of sisters is a result of an extraordinary period in the Catholic Church in the United States. The number of sisters in the United States peaked in 1965 at 181,421 sisters. This was far from the historical norm and the Church received decades of service from these women. After 1965, new entries began to slow. A sister who entered religious life at the age of 25 in 1965 would be 82 years old today. We are unfortunately seeing the passing of this extraordinary generation of women.

Yet, women have continued to enter religious life since 1965 and there will be many more than “1,000 nuns left” in 2042. The “current trend” in the data will not continue as the rate of decline will slow and stabilize around a population of sisters that numbers more than 10,000 rather than fewer than a thousand.

7.27.2022

Size of the Hispanic Catholic Population Has Stalled. But…

The Catholic affiliation percentage among Hispanics in the United States has been in decline for the last 15 years. In 2006, 69% of Hispanic adults self-identified as Catholic in the General Social Survey (GSS). In 2021, the Catholic affiliated percentage had declined to 49%. Increasing numbers of Hispanics are identifying as a non-Catholic Christian or as not having any religious affiliation.

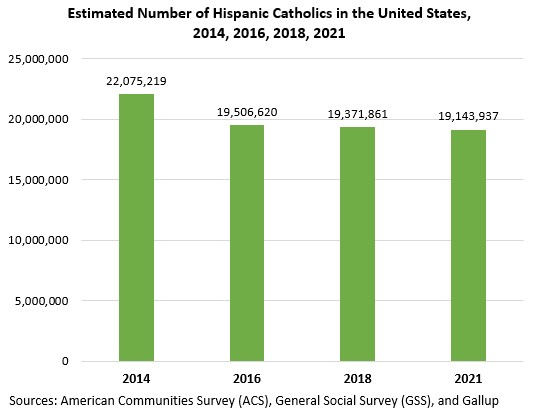
With this decline in affiliation, the share of Catholics who are Hispanic has remained within the 33% to 37% range in the last 15 years. This has occurred while the Hispanic population has grown in the United States. The decline in affiliation among the growing population has meant there is not a lot of change in the share of adult Catholics who self-identify as Hispanic. In 2021, 34% of Catholic adults were Hispanic. Since 2016, the total estimated number of Catholics who are Hispanic has exceeded 19 million (assuming children have similar affiliation percentages to their parents).

In 2019, the Pew Research Center asked a national sample of 3,030 Hispanics about how important aspects of life were to “what being Hispanic means to you.” “Being Catholic” is not an aspect that is considered important by many Hispanics. Sixteen percent of Hispanics said this was “essential” and 23% “important but not essential.” Fifty-nine percent said this was “not an important part of what being Hispanic means to me.”


“Being Catholic” was just one of many things respondents were asked about. The item most associated with being “essential” is “speaking Spanish” (45%) followed by “Hispanic Heritage or descent” (32%), and “socializing with Hispanics” (29%).


One of the biggest contributors to this change in Hispanics is the drop in the retention rate for young Hispanics who were raised Catholic. According to the 2006 GSS, 82% of Hispanics raised Catholic remained Catholic as adults. By comparison, only 66% of those raised Catholic remained in the faith as adults in the 2018 GSS. The retention rate for non-Hispanics was even lower, 63%, in 2018.

Will Catholics in the United States ever be majority Hispanic? Maybe. But it might be awhile and the current declines in retention and affiliation would need to stay steady at rates where they were in 2021. Let me explain.

Let’s say 22% of the U.S. population continues to be Catholic in the future (as it has within a few percentage points positively or negatively since 1945) and 49% of Hispanics self-identify as Catholic. In 2040, 52% of Catholics would be expected to be Hispanic.

The problem with that scenario is that the Catholic affiliation rate among Hispanics may continue to decline. Or maybe not. For example, Italian American affiliation with Catholicism was 89% in 1972 according to the GSS. This declined to 56% in 2010 but has remained stable just above the 50% mark since.

If current trends in Catholic disaffiliation in young Hispanics were to continue, based on linear regression analysis Hispanic affiliation would fall to 22% in 2040. I doubt this will occur. If it did, it would be unlikely that Hispanics ever make up a majority of the Catholic population in the foreseeable future even with significant population growth.

6.09.2022

How much does the Catholic Church in the United States pay its priests (and lay employees)?

By Michal Kramarek, Ph.D.

CARA has recently concluded the National Diocesan Survey: Salary and Benefits for Priests and Lay Personnel. One of the many questions explored in the report is how much the Catholic Church in the United States pays its priests. The median annual salary of a diocesan priest in 2022 is estimated at $33,439 (see the chart below). The median annual salary received by a newly ordained priest is $30,211.


The salary is the first, typically the most substantial, component of diocesan priest’s taxable income. The second component, other taxable cash income, constitutes about 18 cents of every dollar of priests’ income and includes, for example, an allowance for housing, food, car and general expenses. Altogether, a diocesan priest makes $9,018 in other taxable cash income.

The least substantial component of diocesan priests’ income is other taxable non-cash income, accounting for 14 cents for every dollar of total income. Non-cash income includes, for example, diocesan housing, meals prepared for priests as well as priest retreats facilitated by the arch/diocese.

The three components add up to a median overall taxable income of $49,171 for a diocesan priest. How much is it in comparison to other U.S. males who share a similar level of education? Not very much. Between 1996 and 2022 (in the ten years for which the data are available or estimated), diocesan priests’ taxable income accounted, on average, for 56% of the income of men ages 25 and over, with a Master’s degree, in the United States. See the chart below (the dotted line indicates missing data). 


Diocesan priests’ income is fluctuating over time. In the examined time period (between 1996 and 2022), diocesan priests’ median annual taxable income grew by 2%. But in the last five years (between 2017 and 2022) it decreased by 7% after adjusting for inflation.

How does diocesan priests’ compensation compare across different job assignments and experience levels? How do lay employees compare to diocesan priests in terms of salary and benefits? How do all those groups compare across different regions? Those are some of the questions CARA explored in the recent report National Diocesan Survey: Salary and Benefits for Priests and Lay Personnel, commissioned by the National Association of Church Personnel Administrators (NACPA).

A more detailed list of topics included in the report can be found in the table of contents here.

The report can be purchased from NACPA (https://www.nacpa.org) through their online store here: https://www.nacpa.org/diocesansalarysurvey2022


Search This Blog

Blog Archive

© 2009-2024 CARA, Mark M. Gray. Background image courtesy of muohace_dc.