Nineteen Sixty-four is a research blog for the Center for Applied Research in the Apostolate (CARA) at Georgetown University edited by Mark M. Gray. CARA is a non-profit research center that conducts social scientific studies about the Catholic Church. Founded in 1964, CARA has three major dimensions to its mission: to increase the Catholic Church's self understanding; to serve the applied research needs of Church decision-makers; and to advance scholarly research on religion, particularly Catholicism. Follow CARA on Twitter at: caracatholic.

12.21.2010

Changes in Number of Parishes... and Congressional Seats?

At CARA we are often called by reporters working on stories about parish closures. Almost always the reporter is looking for a quote or statistic that can confirm their assumption that the closure of a parish is a new sign of an imploding Catholic Church (it's a common narrative!).

We typically have to caution the reporter on jumping to conclusions based on a single anecdote and then ask a few questions ourselves. Is this parish in an urban area? Is it located in the Northeast or Midwest? Is there a priest shortage in the diocese? All these factors are more likely to be the root of the closure rather than the generalized impending doom in many reporters' heads. I've commented on why this narrative is so misleading elsewhere.

Here is a new correlation to ponder. Today the U.S. Census Bureau released results that will affect the apportionment of the U.S. House of Representatives. The big winners? The South and West and especially Texas (picking up 4 seats). The losers? The Northeast and Midwest which have both become smaller population regions.

Here is a nice summary and map of these changes from the Boston Globe

Compare the map linked above to the one below that represents changes at the state-level in the number of Catholic parishes from CARA researcher Mary Gautier:


Why is there such a strong resemblance? Do parish closures cause losses of House seats? Of course not. That would confuse correlation with causation. However, both have common roots: population shifts and changes. The biggest gainer in both parishes and House seats? Texas. On the other hand the greatest losses are seen in New York.


12.20.2010

Recipe for a None: Life Seen a Bit Less Wonderful?

 
Robert Putnam’s highly anticipated American Grace is one of several new studies that highlights America’s most widely discussed emergent religious group—the “Nones.”  As Putnam and co-author Campbell describe, this group “consists of people who report no religious affiliation. … When asked to identify their religion, they indicate that they are ‘nothing in particular.’” (p.16).

A recent Pew study found that that Nones have average levels of knowledge about religion  (16.6 correct answers compared to the national average of 16 correct). Yet, two much smaller sub-groups of Nones—those self-identifying as Atheists and Agnostics—are shown to be remarkably more knowledgeable about religion than those with a religious affiliation (yet Putnam also notes, “while atheism has recently gained prominence, particularly on the bestseller lists, self-identified atheists and agnostics comprise a vanishingly small proportion of the U.S. population”). These results along with trends in the growth of the Nones documented by the American Religious Identification Survey (ARIS) have led some commentators to pose an interesting question. Does knowledge somehow lead to disaffiliation and/or secularization? Some clearly think so…

Dave Silverman, president of American Atheists, responded to these Pew results in The New York Times saying, “I have heard many times that atheists know more about religion than religious people. Atheism is an effect of that knowledge, not a lack of knowledge. I gave a Bible to my daughter. That’s how you make atheists.”

Yet, if it were as simple as Bible study (X) leads to Atheism (Y) then Evangelical Christians in America would have likely read themselves out of existence in one or two generations. We would also expect that the Harvard Divinity School and Notre Dame’s Department of Theology would be producing many young “New Atheists” to join the likes of Richard Dawkins and Christopher Hitchens. It is clear that there are more than a few methodological flaws in Mr. Silverman’s “recipe” for making atheists.

Mr. Silverman might also think twice about his evangelization techniques after reading Pew’s other recent important study, Faith in Flux, where the researchers conclude, “Paradoxically, the unaffiliated [Nones] have gained the most members in the process of religious change despite having one of the lowest retention rates of all religious groups [only 47% of those raised unaffiliated stay unaffiliated as adults]. Indeed, most people who were raised unaffiliated now belong to a religious group.” In other words, there is a good chance that Mr. Silverman’s daughter will leave the non-faith she was raised in for a religion someday (…and luckily she already has a Bible). 

Pew has also shown that the acquisition of scientific knowledge is not what has led to most of the growth in the Nones as is often posited. The Fath in Flux results indicate that “only 32% of former Catholics [now Nones] and the same percentage of former Protestants [now Nones] agree that science proves religion to be superstition, and fewer still (less than a quarter) say it was important in their conversion.”

The causality for creating Nones must be much more complex than the acquisition of any type of knowledge (flawed or not, meaningful or trivial). My own hunch is that Nones are most often created out of the context of their lives.

Earlier this year, Melissa Cidade and I used the College Student Beliefs and Values (CSBV) survey from the Higher Education Research Institute (HERI) to study religious changes in students attending Catholic colleges. Overall, we found that 8% of all students who enroll in Catholic colleges and universities are Catholic upon entry but then leave the faith by graduation. We found that the students who leave during college were less likely than those who stay Catholic to attend religious services frequently or to believe in God before beginning college. Thus, the students who end up leaving the Catholic faith entered already weak in practice or belief.

Once in college they then seem unprepared to deal with some of the challenges of early adulthood. We found that those Catholics who leave the faith in college are among the most likely to say their faith has been weakened in college by the death of a close friend or family member, natural disaster, or the War in Iraq. They are also among the most likely to indicate they have “frequently” struggled to understand pain, suffering and death, and have felt distant from God.   

Those who become Nones at Catholic Colleges are unlikely to have made this change because of anything taught (or not taught) in class. It is not about their amount of knowledge (or lack of it) on anything meaningful or trivial. It’s more often about their experience—specifically tragic experiences early in their lives where they are unable to reconcile their faith (which had been infrequently practiced before college) with something awful that happens to them or a loved one.

Given these results, my hunch is that the Church will not prevent new Nones with better religious education alone. Instead what may be more necessary is improved ministry to young adults (the median age for those who leave the Catholic faith is 21)—especially the bereaved to help them understand and deal with the tragedies of life.

If the Catholic Church, along with other religions fail to stem the loss of the faithful to the faithless what can we expect?

Some question whether human beings can act morally without the influence of religion. That is a silly question as it is clearly possible. The more important question is how often will human beings act morally without the influence of religion? Here we can speak more in terms of probabilities and data are available.

The analysis below utilizes recent data from the General Social Survey (GSS)—which is also used widely in Putnam and Campbell’s American Grace. We compare respondents in this survey who have some religious affiliation to those who do not (Note: the analysis is limited to years in which the questions were asked. We use the most recent available data and also try to combine multiple surveys to minimize margin of error). Among those with a faith we also break out the results for Protestants and Catholics for comparison.

On measures of altruistic love the Nones underperform compared to those of faith. They are less likely than those with a religious affiliation to say they would:  
  • rather suffer than let a love one suffer
  • that they would endure all things for the sake of the one I love
  • that they are willing to sacrifice their own wishes to let the one I love achieve his/hers
  • that they cannot be happy unless I place the one I love’s happiness before my own
As the figure below shows, religion falls well short of achieving the ideal result as well. All of the percentages for the religious affiliated are lower than what one might hope for. However, the difference between the religious and the Nones is consistent and clear.


Differences are not limited to beliefs and the hypothetical but to reported behaviors as well. In terms of social action, such as giving food or money to a homeless person, doing volunteer or charity work, or being honest and returning money to a cashier after getting too much change, the Nones again perform below the levels of religious Americans. The gap is not massive but again consistent. It is also clear in these results that religious affiliation alone again does not inspire people to the ideals that their faith may call them to.


Still not convinced? Here are three more figures showing findings related to empathy.


The Nones are less likely to feel protective of people being taken advantage of and less likely to have tender, concerned feelings for those who are less fortunate than them.


Two other GSS questions in the reverse direction create more consistent results. The Nones are less likely than the religious to say statements about not feeling pity for someone treated unfairly and not feeling sorry for people having problems do not describe them very well.

The results of the final empathy figure indicate that one may be less likely to expect a helping hand from one of the Nones than someone who is religious. 


A skeptic might interject at this point with the argument that Nones are just being more “honest” and that religious Americans are responding in a way that is more consistent with the expectations their religions have on them. Perhaps. Experimental evidence would be useful in confirming (or disconfirming) the patterns observed in the survey data. But I know of no evidence that indicates Nones might be more honest than religious or less susceptible to the pressures to appear like a “good person.”

And of course there is no shortage of anecdotes about horrible things religious people have done and saintly deeds by people without a religious faith. Yet individual exceptions do not invalidate larger trends and patterns. And there is more…

As indicated in the HERI data it is also clear that the Nones, on average, have experienced more trauma and tragedy in their lives than those with a religious affiliation. As I have hypothesized these negative experiences may in part explain why and how these people came to be Nones.

Luckily tragedy and trauma are relatively rare on an annual basis in a population of more than 300 million. However, these events are slightly less rare for the Nones than the religious. Those without religion are more likely than those with an affiliation to say that in the year surveyed they have been arrested, had a drinking problem, or had serious trouble with a spouse/partner or a close friend.


As shown below, a third of Nones say they have felt they were going to have a mental breakdown at some point in their life and nearly one in five (18%) say they have felt that they had a mental health problem at some point. Religious Americans are less likely to indicate either. More so the religious are more likely than the Nones to say they are “very happy.” 


Even though Nones are slightly less likely than religious Americans to indicate they live in or near areas they consider unsafe, the Nones are significantly more likely than the religious to report that they have ever been beaten or punched or threatened with a gun or shot at. A majority of the Nones (55%) report a physical assault and more than one in four report an incident with gun. Nones are literally more likely than the religious to have seen their lives flash before their eyes.


As one might expect a life more likely to include these traumatic experiences could alter perceptions of human nature. Thus, it is not surprising that Nones are slightly less likely than those with a religious affiliation to trust others as shown in the figure below.


Nowhere is the slightly more nihilistic point of view of the Nones more prevalent than in their attitudes regarding life issues. Perhaps this is an effect of living a less than wonderful life? (from their perspective of course... sometimes everyone need a Clarence to point out meaningfulness). Nones are much more likely than those with a religious affiliation to support abortion on demand, embryonic stem cell research, and suicide if someone “is tired of living and ready to die.”  The one exception is with the death penalty for convicted murders where Nones are generally less supportive of this institution than those of religious faith (the difference between Catholics and Nones is within the margin of error).


These findings are not unique. In fact Putnam devotes an entire chapter to “Religion and Good Neighborliness” in American Grace mostly using more comprehensive data from the survey conducted for the book. Here he concludes, “Religious Americans are generally better neighbors and more active citizens. ... It is religion's network of morally freighted personal connections, coupled with an inclination toward altruism, that explains both the good neighborliness and the life satisfaction of religious Americans” (p. 492). Yet, Putnam also poses the all important question of correlation or causation as well in this chapter.

It is true that Nones are by no means a demographic random sample of the U.S. adult population. As one can see below Nones are slightly younger than Catholics and Protestants and Nones are also disproportionately male. In a related manner they are less likely to be married and have children (also note that 22% were raised Catholic).
 
 
So is it a lack of religious affiliation or the fact that Nones are disproportionately young males that can explain the results shown in the figures above? Here comes the science/statistics....

Results from a series of regressions are shown in the table below. Entries with a * represnet a statistically significant relationship. The columns represent the effect of being a None, next of age, and finally of being male. Thus, these regressions test for the effect of being a None while controlling for the effects of age and gender. Generally the effects of religious nonaffiliation remain consistent with the figures shown above with the exception of having being arrested. This is more often a result of being a young male.


There are many implications for the results above and those in Putnam's American Grace. If current trends continue and Nones become an even larger share of the population, whatever remains of the neighborly, altruistic, and civic culture of the United States may deteriorate further. However, in every recipe there is a chance to alter the chemistry...

What if religions in America could do a better job at helping young people understand tragedy and help them cope with loss and disappointment? Perhaps if religious discourse today, which often focuses a lot on sinfulness, could also include a means of combating sadness fewer of the flock would be lost?


Give it a try. If you see a None you know this Christmas ask them how they are doing. Listen and help as you can. Be the Clarence they may have always needed in their life.

Top photo courtesy of shimelle at Flickr Creative Commons.

11.25.2010

Pies, damned pies, and statistics: Is the Catholic population growing?


Are you Catholic and in need of something to be thankful for this year? The Catholic Church in America is growing and may be primed to grow significantly in the next few decades.

What did he just say? All the Catholic-related stories in the news are about parish and school closings, a Church in crisis, and people leaving the faith…

First, the news is not always a good reflection of reality. A big part of the problem is that many reporters and commentators on religion seemingly have a limited understanding of the basic properties of a simple mathematical expression—percentages. This gets dangerous when combined with a nasty human habit of only using numbers and statistics when they fit the narrative one is seeking to display (while avoiding the data that disconfirms it).

At this point you could choose to quote Mark Twain but that will not make reality disappear (by the way Twain was neither a statistician nor the originator of the infamous phrase—he thought he was quoting Disraeli. And even this was likely an incorrect attribution).

So here is that necessary dose of reality… Since the end of World War II, on average, 25% of the U.S. adult population has self-identified in national surveys as Catholic (±2 to 3 percentage points attributable to margin of sampling error). This spans many trusted sources from commercial polling by Gallup and others, news media polls, exit polls, and academic surveys such as the General Social Survey and the World Values Survey. For example, in the Pew Religious Landscape Survey—the study most often quoted or cited in stories about the Catholic Church in crisis, the Catholic population percentage was 23.9% (±0.6 percentage points).

When cited, these historical results are often characterized as evidence of a tenuous “stability” in the Catholic population. Many seem to believe this means a lack of growth and new membership—even stagnation in the Church. This is a distortion of reality.

What if you were coming over to my house for Thanksgiving this year and as in the past I always give you a slice of pumpkin pie that is equal to 25% of the total pie dish. But in years past I always used 8 inch pans to cook the pie and this year I am using 12 inch pans. You are still only getting exactly 25%. Will you be eating more this year? Of course! The pan is 50% bigger.

The figure below shows growth, in two dimensions, of the Catholic population over the course of American history. Early estimates (pre-polling) are drawn from The Churching of America 1776-1990 (Roger Finke and Rodney Stark, Rutgers University Press, 1994) while the later rely on multiple national public polls (example). The chart tracks growth in the Catholic population percentage from 2% in 1776 (45,000) to 25% in 2010 (77.7 million). The size of the circles represents the total size of the Catholic population.


In both 1975 and 2010, the estimated Catholic population percentage is 25%. Yet the difference in individuals these identical percentages represent is 23.2 million people (54.5 million in 1975 compared to 77.7 million in 2010). Is that stability or growth? If you were baking them all pies you better consider it growth.

In the last 40 years, the Catholic population has grown by about 75%. If it did the same in the next 40 years it would be 136 million in 2050 and represent about 31% of the projected U.S. population at that time. This however is an unlikely scenario as overall population growth has slowed in the United States and is expected to slow more as the Baby Boom, and the "echoes" from it, fade.

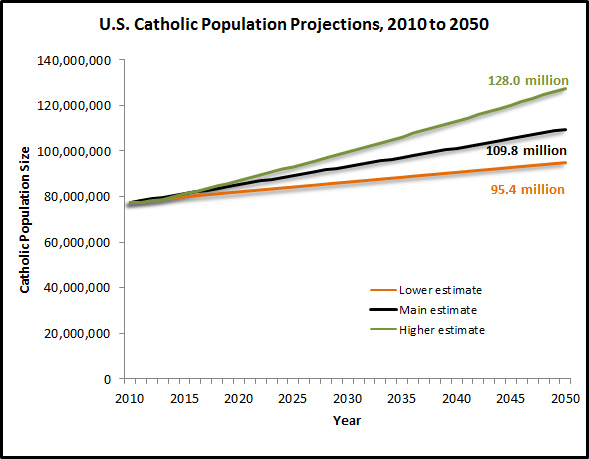
The figure below shows a range of three projections.


The lowest estimate is based on a regression method—which ignores expected population growth as estimated by the U.S. Census Bureau in the future and instead relies simply on applying an average estimate of change in the number of Catholics in each year from the historical record into the future. This is an extraordinarily conservative approach as we know some population growth is likely to occur and some of that growth will include more new Catholics. If this scenario were to unfold the Catholic population would increase by only 23% from 2010 to 2050, when it would then be 21% of the U.S. population at about 95.4 million (NOTE: This may be the most likely scenario given research conducted by CARA in Feb. 2013).

This is a good example of one of the seemingly most difficult concepts involving percentages for people to understand… The Catholic population percentage could decline from 25% of the U.S. population in 2010 to 21% in 2050 and there still would be more Catholics in 2050 then there were in 2010.  The proportion of the slice would have grown smaller but the pie has grown larger and thus the amount of pie in the slice will be bigger.

The next two projections are rooted in Census data—the actual projections the Bureau foresees for the total U.S. population.

The mid-range projection is simple. If the future replicates the past 65 years, in which Catholics have been 25% of the U.S. population, the number of Catholics in America will grow by 41% and total 109.8 million in 2050. Given several decades of history this may be the most likely future to expect. However, there are other important demographic changes ahead that may boost the Catholic population even higher…

The final and highest projection accounts for differences by race and ethnicity. In recent years, polling has consistently indicated that about 60% to 65% of Hispanics/Latinos in the United States self-identify as Catholic. However, there is also evidence that this percentage is dipping slightly lower. This projection assumes this falls even further—to only about 55% and that Catholic self-identification among the non-Hispanic population measures about 18.5%. Both assumptions are on the conservative side. However, even with only assuming 55% Catholic identification among Hispanics/Latinos, the rapid growth expected in this sub-group will likely boost Catholic population numbers significantly (this is even the case if it falls further than 55%). This projection leads to an expected growth in the Catholic population of 65% between 2010 and 2050 with a Catholic population total of 128 million in 40 years, representing 29.2% of the total U.S. population.

The Census Bureau’s 2010 Current Population Survey (CPS) estimates that 16.1% of the U.S. population self-identifies as Hispanic or Latino. This is expected to grow to 29.2% in 2050 (after registering 12.5% in Census 2000). This projection estimates that in 2038 there will be more Catholics who self-identify as Hispanic/Latino than those who do not. It is also important to note that although non-Hispanics will become a smaller percentage of the Catholic population in this projection, this segment will still be growing—just at a slower rate (by an estimated 19% between 2010 and 2050).


You likely have questions and comments (let me guess)…

Q: Didn’t Pew find that nearly “one in three” people raised Catholic leave the faith leading to an astounding “one in ten” adult Americans who are formerly Catholic? How could the population grow with losses like these?

A: This study did indeed. I have commented on this for CARA and in America where I called this the “phantom crisis.”  Let me provide a metaphor with a non-religious example. In the last year, Laurie Goodstein of The New York Times has frequently cited Catholic population losses in her coverage of the Church. I'll use The Times as my example:

The Times is currently operating in “severe” crisis. It has incurred a loss of 20% of its paid subscriptions in the last decade and its stock price has plunged 74% during this same period. Things have turned so poorly that recently the publisher announced that an eventual “stop print” date is in future sight. Also, 100% of readers of The New York Times die.

The statement above is unfair and although true, only partially so. Many other papers have and are facing steep declines in circulation and 100% of readers of all newspapers die eventually. The statistics I used above isolate The Times out of context of wider trends or comparisons to other newspapers. Perhaps what The Times is experiencing is quite “normal” or even better than what other papers are going through given the technological, cultural, and social changes occurring in the United States and around the world. The example also ignores The Times online presence and the large amount of traffic it attracts as well the effect of the recession on its stock price.

Similarly, the ubiquitous Catholic “one in three” finding drawn from the Pew study is consistently quoted without context. Most often the number is used to drive a narrative—an undeniable signal of extraordinary crisis. For example, a recent article in Commonweal, Peter Steinfels notes “one out of every three adult Americans who were raised Catholic have left the Church” and characterizes these as “devastating losses” and a sign of “American Catholicism’s crumbling condition.”

Yet, quoting the “one in three” result of the Pew study in isolation can be extraordinarily misleading. Below is a visual of the typical context provided in the media.


The different and fuller view below provides the correct perspective.


All things considered, Catholicism does a better job of keeping those raised in the faith than any Protestant denomination (68% of those raised Catholic remain so as adults). The typical response to this is “but Protestants are just switching denominations” as if moving from one denomination to another is similar to Catholics switching parishes and having your records “sent over.” In the real world (as opposed to the categorizations within sociology of religion) such a point of view seems a bit foolish.

As a term, “Protestant” has significant meaning historically and sociologically but it is not an institution and few Americans actually identify their faith as such and instead name the denomination of their church. If someone leaves a Methodist church for a Baptist church that is a real change for the individual and both churches. The churches have independent memberships, styles of worship, and are completely separate entities. I don’t think Presbyterian churches are just “fine” with losing an estimated 59% of those raised in that denomination if these individuals simply go to another Protestant denomination. I’m sure they consider these losses religious switching and real change regardless of the characterizations researchers or the media attempt to make about people “just going to another Protestant church.”

Also, the Pew study did not discover some “new” phenomenon of religious switching. This is rather old news among social scientists who study religion (e.g., see Bradley Wright, a sociologist, and Rodney Stark, an economist, commenting in “The Leavers”). However, it was news to the media and the general public who seem to believe the switching is as recent as the study and news stories about it. 

The losses that the Catholic Church has experienced are regrettable but also quite normal (and as shown above among the most minimal compared to other religions or even the “Nones”). In a free and religiously diverse country, no religion will keep 100% of those raised in the faith and are unlikely to maintain even 90% or 80%. Note that Pew’s Religious Landscape Survey report estimates that 31.4% of the U.S. adult population was raised Catholic. However, you will never find a time historically in the data when anywhere near 31.4% of the U.S. population actually self-identified as Catholic. How can this be? Because losses have occurred over such a long period of time. Many believe the Pew study indicates a recent mass exodus from the Church. This is clearly not the case. Both Pew and CARA research shows the losses have occurred over many decades—the lifespans to date of all those alive now who were raised Catholic. CARA surveys indicate a half of the losses occurred before 1988 and there is no year or short period of time that stands out as an outlier that would indicate a sudden large drop in Catholic affiliation. 

The losses incurred by the Catholic Church have also most often been among a very specific group—young people. As Pew found in a follow-up to the Religious Landscape study: “Almost half of Catholics who are now unaffiliated (48%) left Catholicism before reaching age 18, as did one-third who are now Protestant. Among both groups, an additional three-in-ten left the Catholic Church as young adults between ages 18 and 23. Only one-fifth who are now unaffiliated (21%) and one-third who are now Protestant (34%) departed after turning age 24. Among those who left the Catholic Church as minors, most say it was their own decision rather than their parents’ decision.” Similarly, CARA surveys have estimated the median age of a former Catholic to be 21. Thus, the poster-image for former Catholics is not a middle-aged New Englander of European descent storming out of the pews in anger. Instead it is a disaffected teenager.

Following the Pew study, many now often frequently cite that “one in ten Americans” is formerly Catholic. What these individuals seem not to realize that one in four is Catholic. In general people don’t have a good understanding of the sheer size of the Catholic population. For example, I have noted elsewhere that the recent trend in infant baptisms is down slightly. However, there are still enough people joining the Catholic Church each year to sustain the population. In 2009, The Official Catholic Directory reported 857,410 infant baptisms, 43,279 adult baptisms, and 75,724 receptions into full communion in U.S. dioceses. This totals 976,413 in one year (and does not include the number of former Catholics who have returned to the faith or immigrants who entered the Church elsewhere and who moved to the U.S. in this year). To put that in context, the number of new Catholics in 2009 would make this one-year cohort of new Catholics approximately the 26th largest membership Christian church in the United States (also similar in size to all Jehovah’s Witnesses or about half of all Muslims in the United States).

Q: The Catholic Church is inflating their numbers. There is no way this many people are still Catholic.

A: The Church has very little to do with the data utilized here. They are derived from polls over which the Church has no control or influence as well as U.S. Census data. The polling estimates are based on “self-identification” of respondents and these are almost always larger than the Church’s own estimates either in The Official Catholic Directory or Vatican statistical publications.

Q: Aren’t surveys only conducted with adults?

A: Yes, surveys typically only include adults age 18 or older. Thus simply applying these percentages to total population figures (including those under 18) may not reflect reality precisely. However, it is likely that the Catholic percentage of the under 18 population is even higher than it is for adults. Why? Latinos in America—of which about 60% to 65% currently self-identify as Catholic—are more likely to be of parenting age than those of other races and ethnicities and have a higher fertility rate than non-Hispanics. Thus, there are reasons to believe that applying the adult Catholic population percentage to total population figures underestimates the total size of the U.S. Catholic population.

Q: What about all the parish closures. This is a sure sign of decline. How can the Catholic population grow at a time like this?

A: As one can see from the first figure above, few Catholics resided in the United States at its founding. Nearly all have come later as immigrants and continue to do so. For generations Catholic immigrants have often started their new lives in industrial urban areas. They created parishes where others spoke the same language. Sometimes a Polish parish would be built across from a parish where Italian was the language in use. The sheer number of people involved led to a boom in parish construction and along with schools—often in close proximity to each other. Yet, in the post-World War II era things began to shift. Many Catholics moved to the suburbs and away from the Northeast and Midwest into the Sunbelt. New waves of Catholic immigration from Latin America have led to even more growth in the South from coast to coast. The Catholic population has realigned itself in the course of a few generations. People move, parishes and schools do not. Many of the parish and school closings one reads about are in inner cities of the Northeast and Midwest where Catholic population has waned.

Another factor in parish closures is the priest shortage. Yet, even in these cases adjustments are often being made. New models of parish ministry are emerging to ensure the vitality of parish life including the use of shared ministries, clustered parishes, and Canon 517.2. Also, international priests continue to step in to meet the needs of a growing Catholic population.

Q: What about the clergy sex abuse crisis? I know people who have left the Church over this.

A: Some have, but the data indicate fewer than many assume. Pew found that fewer than 3% of former Catholics cited sex abuse when asked to describe in their own words the main reason for leaving the Catholic Church. When presented with a list of potential reasons from which they could select all that applied to their decision, 27% of former Catholics who are now unaffiliated cited sex abuse as one of the reasons for leaving and 21% of those who are now members of a Protestant denomination responded as such. For those now unaffiliated 71% said they just “gradually drifted away.” Among those now members of a Protestant denomination 71% said their “spiritual needs [were] not being met” by the Catholic Church and 70% said they “found a religion they liked more.”

If one extrapolates, using the percentages from the Pew surveys and population data, to estimate the number of adults who have left the faith primarily (i.e., the main reason in their own words) because of the sex abuse crisis, this totals about 700,000. If one also includes all those who cited it as one of multiple reasons there are more than 5.6 million former adult Catholics who are estimated to have left the Church in-part because of the sex abuse crisis—although other issues were important to their decision as well. Note, these individuals could have left at any time in the last six decades having had local knowledge and experience with this in addition to the other reasons they cite for having left the faith and not necessarily post-2002 when this became a national story (as noted above, there is no uptick in disaffiliation in the data for the 2000s). If these 5.6 million former Catholics had remained affiliated the Catholic population percentage in the U.S. would currently be 26.8% rather than the estimated 25%.

Q: Who cares if the Catholic population is growing while Mass attendance declines?

A: Although Catholic Mass attendance did decline in recent decades from a peak in the 1950s, there has been no decline in Mass attendance percentages nationally in the last decade. Just under one in four Catholics attends Mass every week. About a third of Catholics attend in any given week and more than two-thirds attend Mass at Christmas, Easter, and on Ash Wednesday. More than four in ten self-identified Catholics attend Mass at least once a month.

As I have noted in OSV this current stable trend in Mass attendance along with Catholic population growth will likely limit the possibility of additional parish closings in the future.

I am also always confused by individuals who ask a question or make a comment like this. Isn’t the hope of the Church to bring infrequently practicing Catholics back to being more active? Isn’t that what many recent diocesan media campaigns have focused on and the whole point of something like Catholics Come Home not to mention more broadly New Evangelization? Is the Church supposed to ignore the growing number of people in the United States who identify themselves as a member of that faith and focus only on those attending each week? To do so seems like it might even accelerate losses rather than stem them.

Q: If a growing numbers of Catholics self-identify their ethnicity as Hispanic or Latino doesn’t that mean the non-Hispanic Catholics left the Church?

A: Depends on what you mean by “left.” The primary engine behind the growing diversity in the Church is immigration and higher fertility among many of these immigrant communities. A population can shrink dramatically—in a matter of a few generations—if it does not biologically reproduce itself (let alone culturally reproduce itself). Catholics of European ancestry have not replaced themselves at the same rate of Hispanic/Latino Catholics. A couple must have two children to replace themselves, and more children to account for growth. It is not that non-Hispanic Catholics are leaving the faith as in getting up out of the pews and storming out of the Church. Instead many are ‘leaving’ by passing away without ever having contributed to population growth. However, as noted in the projections above, the non-Hispanic Catholic population will continue to grow in the future—just at a slower rate than Hispanic Catholics. 

Q: But I believe the headlines because I have several close friends who used to be Catholic and are just nothing now.

A: Your friends are very unlikely to be a sufficiently-sized random sample of the total or Catholic U.S. adult population. I’m sure they are nice people but what you are presenting is an anecdote. This means little in terms of scientific measurement.

Q: I don’t believe you.

A: That’s OK. I don’t take it personally and the future will unfold as it will regardless of our opinions. If you would like something else to read try this story from TIME Magazine. Take the Catholic population on the day this story went into print and add about 30 million and you’ll have the total for 2010.

Above photo courtesy of pauladamsmith at Flickr Creative Commons.

10.19.2010

Views of the Bible and Belief in the Real Presence

In the previous post we showed interesting similarities among Christians in the United States regarding belief in and knowledge of the Real Presence.  Some additional context is shown in the figure below again using data from the 2008 American National Election Study. There are distinct differences among Protestants by views of the Bible. About seven in ten who believe the Bible is to be taken literally word for word also believe that “when people take Holy Communion, the bread and wine become the body and blood of Jesus Christ.” Among Protestants who do not take the Bible as literally word for word, the percentage who believe in the Real Presence declines.


10.15.2010

Christian belief in and knowledge of Transubstantiation

The Pew Forum on Religion & Public Life’s recent U.S. Religious Knowledge Survey has unearthed evidence of an identity crisis among American Catholics. “More than four-in-ten Catholics in the United States (45%) do not know that their church teaches that the bread and wine used in Communion do not merely symbolize but actually become the body and blood of Christ” (Pew, p. 8).  Among the American public overall, “about half of those polled (52%) say, incorrectly, that Catholicism teaches that the bread and wine used for Communion are symbols of the body and blood of Jesus” (p. 24).

Unlike the discussions surrounding the last major Pew study with significant implications for the Church I have no doubts of the discourse regarding the latest Catholic results. It is very likely the case that only about 55% of Catholics are aware of what the Catholic Church teaches regarding the Real Presence. At the same time, as someone who has been surveying Catholics nationally for nearly a decade I know there is still a deeper story to tell.

There is a gap in Catholics’ knowledge of their Church’s teachings and what their beliefs are. It may be a classic case of source amnesia. Other recent surveys (including CARA’s) indicate six in ten to three-quarters of Catholics believe in the Real Presence. This is most likely among those who attend Mass frequently.  Strangely enough, many Catholics believe what their Church teaches without realizing that their Church teaches it.

Catholics fit into four groups regarding the Real Presence. The first are the Knowledgeable Believers who know what the Church teaches regarding the Eucharist and also express a belief in this teaching. Because majorities of Catholics believe and know of these teachings it is also the case that some percentage of Catholics falls in the group of the Faithfully Unaware. These are truly rebels without a cause who believe in the Real Presence but believe they are doing so (wrongly of course) in opposition to what the Church teaches. It is also the case that some percentage of the Catholic population must be unaware of the Church teaching and also unbelieving in the Real Presence. Although disappointing, there is hope in these “Uns” (unbelieving and unknowing) as these Catholics may come to believe what the Church teaches if they became aware of it. The Church will likely have a more difficult time winning over the Knowledgeable Doubters. These Catholics are aware of what the Church teaches but say they do not believe it.

The only way to know how many Catholics are in each cell of the table below is to ask these two questions in combination (…and if anyone is interested in doing so they could do so in an upcoming CARA Catholic Poll).

The identity crisis unearthed by Pew is by no means limited to Catholics. Another recent survey, the American National Election Study of 2008, shows that other Christians offer up equally mystifying responses to questions regarding the Real Presence.

The ANES asked all Christians (who are citizens of voting age as this is an election study) the Transubstantiation question shown in the table above: Do you believe that when people take Holy Communion, the bread and wine become the body and blood of Jesus Christ, or do you believe that does not happen? 1) Yes, does happen or 2) No, does not happen.  

Seventy-four percent of Catholics surveyed indicated a belief that the bread and wine become the body and blood of Jesus Christ. That is reassuring (and fairly consistent with other surveys regarding this subject). The surprises are in the number of non-Catholic Christians who also state they have this same belief.

Nearly six in ten Protestants (59%) surveyed expressed a belief in Transubstantiation. The Pew survey indicates only 35% of Protestants are aware that the Catholic Church teaches this doctrine. Seven in ten Lutherans express a belief in Transubstantiation and this is not all that surprising considering the teachings within this denomination are sometimes more similar to those of the Catholic Church than those of some other denominations (e.g., “Christ's true body and blood in the Lord's Supper are "hidden under" the earthly forms of bread and wine”).                                                                                             


What is perhaps most surprising is that a majority of all significant sub-groups of non-Catholic Christians in the United States (i.e., those with a sufficient size that the number of interviews allows for an estimate) express a belief regarding the Eucharist that is consistent with Catholic Church teachings. The Pew results also indicate that they do so with little knowledge that the belief they affirm is a teaching of the Catholic Church. Again we may have another case of source amnesia—believing something you once heard but without memory of the source of that belief. The Catholic identity crisis is interesting. I must say the Protestant case even more so. Should the Catholic Church be more concerned that people don’t know what it teaches or surprised that so many non-Catholic Christians believe it—often in opposition the teachings of their own denominations?

How do so many Protestants—including those who identify themselves as “born again” come to believe a Catholic teaching regarding the Eucharist? This teaching was at the heart of anti-Catholic criticisms and caricatures of the Catholic faith for hundreds of years. Other than source amnesia what could this be attributed to? Perhaps another set of Pew survey results provide a clue. Some 59% of Evangelicals say the Bible is the “Word of God, literally true word for word.” If this is the case, many Evangelicals may take a literal reading of the passage such as Matthew 26:26-28 and incorporate this into their beliefs without realizing the literal interpretation is consistent with Catholic teachings that their particular denomination may not agree with (...and there is evidence for this link...).

The exploratory analysis above has its limitations. It is based on two separate surveys and the ANES does not include non-citizens. It is also the case that both survey questions cannot possibly capture all the nuances of the teachings and theology of the Catholic Church on this matter (although both questions are intentionally attempting to reflect these teachings specifically). Despite these limitation it definitely points to a need to explore this issue further.

I have a few more reflections on other aspects of the Pew knowledge study that will follow in the next post…

10.08.2010

On What Wave Did Your Ancestors Ride?


Tuesday, October 12 is the 518th anniversary of Christopher Columbus's arrival in the Americas (at a location in what is now The Bahamas). Although we know Columbus was Catholic there is still some debate of his nationality and ancestry. Most believe that he was from Genoa, in present-day Italy.

The story of Catholicism in America is deeply rooted in waves of immigration that followed well after Columbus. These waves are often remembered today in how American Catholics self-identify their ancestry, which we can measure in polls. For some there is no knowledge or memory of this and these people often just say they are of “American” ancestry. While others still deeply identify with the country of their grandparents or great grandparents, etc.

Yet when one looks at polling data on ancestry for Catholics there are always a few surprises. Perhaps the biggest is that Irish Americans are more likely to be Protestant than Catholic. This has been noted among academics (e.g., “How the Irish Became Protestant in America” by Michael Carroll in Religion and American Culture: A Journal of Interpretation, Vol. 16, No. 1 and “The Success and Assimilation of Irish Protestants and Irish Catholics in the United States” by Andrew M. Greeley in Sociology and Social Research, Vol. 72, No. 4) but is less well known among the media and general public who often assume that Irish and Catholic are virtually synonymous.

On average, only 35% of Americans who say they are of Irish ancestry self-identify their religion as Catholic. By comparison, nearly half of this group (47%) indicates their religion as Protestant.


It is the case that Americans of Italian ancestry are more likely to be Catholic than any other faith (on average between 1994 and 2008, 65% of Americans of Italian ancestry self-identified as Catholic. Although in the most recent GSS survey, in 2008, only 59% of Italian Americans indicated they are Catholic). However, few Americans may realize that there are almost as many adult Catholics today who say they are of German ancestry as there are who say they are of Italian ancestry (even with only about 17% of those of German ancestry self-identifying as Catholic. More Americans claim German ancestry than any other).


The graph below shows the average percentage of adult Catholics in the United States who identify ancestry with countries that have had significant immigration to the Americas in the last 150 years. Each bar represents a decade average with the orange bar showing the last decade.

Overall, the biggest recent shift has been in the number of adult Catholics who self-identify their ancestry with a Latin American country and specifically with Mexico. We have commented elsewhere about the generational shift in the racial and ethnic composition of the Catholic population. Along with this change, Mexican ancestry has grown larger than Italian or Irish ancestry among American Catholics. In the most recent GSS survey, 69 percent of American adults of Mexican ancestry self-identified as Catholic.

Above photo courtesy of Dominic's pics at Flickr Creative Commons.

8.31.2010

There will likely be fewer Catholic baptisms and marriages next year… again.

The August National Vital Statistics Report was just released and it shows fewer Americans (Catholics and non-Catholics) married or had children in 2009 than in 2008. What does it matter? As shown in this post, these two rates are statistically linked to the rate at which the sacraments of baptism and marriage are celebrated in the Catholic Church in the United States. Baptisms and marriages in the Church have declined in number each year since 2001. The crude infant baptism rate (annual number of infant baptisms per 1,000 Catholics) reached a peak during the post-war Baby Boom in 1956 at 36.1. In 2009, this had fallen to only 12.7 infant baptisms per 1,000 Catholics. The crude marriage rate (annual number of marriages celebrated in the Church per 1,000 Catholics) peaked right after World War II at 15.1 in 1947. In 2009, this had fallen to only 2.7 marriages in the Church per 1,000 Catholics.


Despite these trends, the absolute number of Catholics in the United States continues to grow because the number of children born and raised Catholic has been generally sufficient to replace previous generations (life expectancies have risen as well) and other Catholics are added to the population through adult conversion from other faiths and through immigration of Catholics from other countries (even as some who are raised Catholic leave the faith at some point). Since the 1940s, the percentage of the U.S. population self-identifying as Catholic in polls has remained stable at around 22% to 26%.

Yet, it is still of great concern that the absolute number of Catholic infant baptisms continues to dip annually. For example, the number of baptisms, when projected five years into the future, is correlated with entry-level Catholic school enrollment. If baptisms are falling, most likely enrollments will fall at the same pace. Are fewer Catholics choosing to baptize their children? Or are Catholics just having fewer children, as the national trend indicates?  The answer to these questions implies very different potential responses. 

The data indicate that almost all self-identified Catholics having children are baptizing those children (most within a year of birth and some in later childhood years). In 2009, the crude birth rate for the United States was 13.8 per 1,000 population whereas the crude Catholic baptism rate was 12.7 per 1,000 Catholics. Historically, these two rates are strongly correlated (R=.984). Most of the decline in Catholic baptisms is attributable to the decline in birth rates from the Baby Boom peak years. 

The Baby Boom was initiated as many young Americans began catching up for events that would have occurred had the Great Depression and World War II not interrupted so many of their lives. For example, demographer Pascal Whelpton calculated that “the babies born during 1950-54 included roughly 1.6 million that had been postponed during the 1940s or earlier, and 0.9 million that were advanced from 1955 or later because of the tendency of women to marry and have their children at younger ages” (see: “Why Did the United States’ Crude Birth Rate Decline During 1957-1962?” in Population Index, Vol. 29, No. 2, p.122). Yet, since this period Catholics and non-Catholics alike have begun to wait longer to marry and there have been other cultural changes that have affected Americans’ ideas of ideal family size.

 
Between 1947 and 1962 the crude baptism rate was 30 or more per 1,000 Catholics in each year. Demographically, these years represent an extraordinary period. Even as the Baby Boom waned, Catholics tended to have higher fertility rates than non-Catholics for a time and this kept the number of baptisms from crashing along with the U.S. crude birth rate. 

But in the 1980s, social scientists began to identify a convergence of Catholic and Protestant fertility rates (see: “Religious Affiliation and the Fertility of Married Couples” William D. Mosher and Gerry E. Hendershot in Journal of Marriage and the Family, Vol. 46, No. 3.). Later in the 1990s among non-Hispanic white women, the Catholic fertility rate began to fall below Protestant levels as some Catholics began waiting longer to marry or decided not to marry at all (“Religion and Fertility in the United States: New Patterns” William D. Mosher, Linda B. Williams, and David P. Johnson in Demography, Vol. 29, No. 2).

There are many potential ‘x-factors’ for the decline in Catholic fertility which, in turn, led to the decline in baptisms.
  • It has been observed cross-nationally that female participation in the labor force can affect fertility rates. As the figure above shows, women began entering the workforce at higher rates in the 1960s than in the past. However, the negative correlation between female labor force participation and fertility ‘flipped’ in the late 20th century and is now positive in many advanced industrial and post-industrial democracies (see: “Is Low Fertility a Twenty-First-Century Demographic Crisis?” S. Philip Morgan in Demography, Vol. 40, No. 4).
  • The flattening out of the birth and baptism rates in the 1970s and early 1980s also coincided with some of the worst economic times in memory. Although many might argue that the current recession is more severe, it is the case that the Misery Index (unemployment rate plus inflation rate) reached two severe peaks in the 1970s and 1980s that are significantly higher than current readings. These economic troubles may have affected the pocketbooks and psychology of many Americans who in turn decided to put off having children as they did during World War II and the Great Depression. They may be doing so again now, with the nation at war and slowly recovering from a severe recession.
  • Concurrent to these socio-economic changes were two very important Supreme Court decisions. The first is Griswold v. Connecticut (1965) where the Court’s majority argued for a national right to marital privacy in the use of contraceptives. The second was Roe v. Wade (1973) where the Court’s majority argued for access to legal abortion with limitations on the basis of a women’s right to privacy. The Church opposed both decisions and its teachings regarding these issues were outlined in Humanae Vitae (1968).

Below, we measure statistically the impact of these potential factors in a series of regressions. The data are annual and thus any regression model will likely have correlated error terms across observations (the crude baptism rate in year t will be similar to this rate in year t-1). This violates some of the core assumptions of statistical regression modeling. To control for the nature of the time series data we have ‘lagged’ the dependent variable one year as a baseline predictor. To the degree that other variables can account for the remaining variance we can potentially understand changes over time.

As the results for Model 1 below indicate, three of these factors have a measurable statistically significant effect on the crude baptism rate in any given year: 1) the crude Catholic marriage rate, 2) the crude U.S. birth rate, and 3) female labor force participation. Ceteris paribus, there are no statistically significant direct effects related to the crude U.S. marriage rate, the Misery Index, or the Griswold or Roe decisions.


Historically, in periods where Americans were having more children in general, where Catholics were marrying in greater number in their parishes, and where women were more active in the labor force, more baptisms per 1,000 Catholics were celebrated nationally. Yet, Model 1 includes a number of factors that are not statistically significant, which in turn create collinearity problems with other variables (predictors being correlated with each other). The most statistically efficient model including the fewest collinearity disturbances is shown in the table below.

 
The strongest factor identified is still the overall U.S. crude birth rate. Thus, it is possible that some of the independent variables which have no direct effect on the crude baptism rate may affect this indirectly through their influence on the overall number of births per 1,000 population in the United States. We test for this in Model 3 below. Once again we control for the time series nature of the data by lagging the dependent variable. Only one factor other than this lagged variable emerges as statistically significant: the dummy variable measuring the Griswold v. Connecticut decision. This is negative representing a sustained decline in U.S. fertility overall following this Supreme Court decision.


Once again potential collinearity issues indicate the removal of some of the variables may be necessary. The most efficient model is shown below.


In 1964, just a year prior to the Griswold decision and four years before Humanae Vitae, a Harris survey asked a national sample of adult Catholics the following question: “Right now, Catholics are forbidden by the Church from using artificial birth control devices. Would you like to see the Catholic Church decide to allow Catholics to use birth control devices (contraceptives) or would you oppose that?” Fifty-two percent of the respondents said the Church should allow use, 13% said the Church should not, and 33% were not sure. 

Following the Griswold decision, surveys show that the attitudes of Catholics and non-Catholics were generally accepting of contraceptive use. American Catholics Today (D'Antonio, Davidson, Hoge, and Gautier; 2007), shows that there has been little change over time in the percentage of Catholics who believe Church leaders should have the final say about the morality of contraceptive use. Older Catholics are generally more likely than younger Catholics to look to Church leaders on this issue. However, even among those born before 1941, only one in five believe Church leaders alone should have the final say on contraceptive use.


In the wake of these historical events, Catholics and non-Catholics alike began to redefine their notions of a 'ideal' family size. In the 1972 General Social Survey (GSS), 58% of adult Catholics said that they thought the “ideal number of children for a family to have” was three or more (or “as many as one wants”). Response to this question received a GSS series low of 36% in 1998 and has since rebounded to 43% in the most recent GSS of 2008 (In most years the number of non-Catholics responding as such have been very similar).


The decline in the Catholic marriage rate is another story altogether. This is a case where there is not as strong a link to the overall crude marriage rate in the United States (R=.816). Although Catholics have been and are just as likely to marry (and divorce) as non-Catholics in the United States (see: “Marriage in the Catholic Church: A Survey of U.S. Catholics”) there has been a declining number of celebrations of the sacrament of marriage in the Church.  Many Catholics are still marrying but choosing to do so in greater numbers outside of the Church, in a civil ceremony or in another house of worship (without convalidation).

The number of marriages celebrated in the Church per 1,000 Catholics exceeded 10.0 in each year from 1943 to 1952 (the crude marriage rare for the U.S. did the same until 1951). At this point, the post-war Marriage Boom that precedes the Baby Boom began to slow. In 1958, the number of marriages celebrated in the Church per 1,000 Catholics began to consistently fall below the number of marriages overall in the U.S. per 1,000 of the population. As each decade has passed the gap has widened. In 2007, there were 6.8 marriages per 1,000 residents of the United States. By comparison, there were only 2.7 marriages celebrated in the Church per 1,000 Catholics in that same year.


The ‘x-factors’ for marriage decline emerged in the late-1950s and have gained strength as years have passed. The data are far more limited to test potential hypotheses. Many may assume it has something to do with rates of inter-faith marriage—Catholics marrying non-Catholics (In these situations a Catholic spouse presumably must negotiate with a non-Catholic spouse for where the marriage ceremony will take place). Yet, there has been no real identifiable increase in inter-faith marriages in recent years. These peaked within the Church between 1975 and 1980 (above 35%). The percentage of marriages celebrated in the Church between a Catholic and non-Catholic spouse has been below 30% since 2002.


There is no indication that marriages outside of the Church involving Catholics are becoming more likely to involve a non-Catholic spouse. Data for these are difficult to obtain, as they could be celebrated in a variety of other religious settings or in a secular venue. Surveys regularly ask about the religion of spouses at the time of the poll. However, these cannot tell us what faith they were in at marriage (and these marriages could have been celebrated this year or 40 years ago). According to the General Social Survey an average of 20% of Catholics were married to a non-Catholic spouse in the 1970s. In the 1980s this figure was 21% followed by 24% in the 1990s and 23% in the 2000s. Differences between decades are within survey margins of error for the Catholic sub-group. Thus, there is no significant measurable increase overall in the percentage of U.S. Catholics who say they are married to a non-Catholic.

The fact remains there is a very real measurable decline in the percentage of Catholics choosing to marry in the Church, along with fewer baptisms each year. Given past trends and the current state of the economy, 2010 is unlikely to be a year in which the number of celebrations of these sacraments increases.

Search This Blog

Blog Archive

© 2009-2024 CARA, Mark M. Gray. Background image courtesy of muohace_dc.