Nineteen Sixty-four is a research blog for the Center for Applied Research in the Apostolate (CARA) at Georgetown University edited by Mark M. Gray. CARA is a non-profit research center that conducts social scientific studies about the Catholic Church. Founded in 1964, CARA has three major dimensions to its mission: to increase the Catholic Church's self understanding; to serve the applied research needs of Church decision-makers; and to advance scholarly research on religion, particularly Catholicism. Follow CARA on Twitter at: caracatholic.

10.10.2018

The Contribution of Religious Sisters to Parochial Schools in the United States


This post is authored by CARA researchers Michal Kramarek and Fr. Thomas Gaunt, SJ (also CARA's Executive Director). It provides a brief look at the contribution of religious sisters to the parochial schools in the United States. The bibliographic information for the references included in the text can be found here. 

Written discourse about Catholic parochial schools in the United States has been in decline since 1970’s. In fact, after enjoying over a century of higher attention, the frequency with which the topic appears in American publications in recent years is reverting to levels prior to the Third Plenary Council of Baltimore of 1884 (as shown in the chart below).


While the motto of “Every Catholic child in a Catholic school” attributed to the Council was never fulfilled (Hunt and Kunkel 1988, 286), the accomplishments of those who often committed their entire lives to its pursuit are nonetheless remarkable. The scale of those accomplishments can be illustrated by the sheer size of the parochial school system in its heyday, in the 1960’s:
  • In 1960, there were 68 Catholic schools for every 100 Catholic parishes (Kenedy 1961).
  • In 1963-1964, there was an all-time high of 13,205 Catholic elementary and secondary schools (Snyder 1993, 49).
  • In 1965-1966, there was an all-time high of 5.6 million baby boomers in Catholic elementary and secondary schools which constituted 87 percent of nonpublic school enrollment (Hunt and Kunkel 1988, 277) and 12 percent of the entire Catholic population (Kenedy 1966).
  • In the 1960s, “[t]here was hardly a town of more than 30,000 inhabitants in the United States lacking a parochial school” (Stewart 1994, 428).

 
Those remarkable accomplishments bring about the issue of how it was all possible. After all, the financial cost of such an undertaking must have been considerable. Or, was it? The answer to this question depends on the point of reference. For example, Burns (1912, 290-293) estimated the overall cost of education in Catholic parish schools nationwide (including cost of maintenance, salaries, supplies, apparatus, heat and light, repairs, interest and insurance), in 1909, at $9,898,008 ($268 million in 2017 dollars). By comparison, he estimated the cost of the equivalent education in public schools to be over three times higher, at $30,511,010.

The rise and decline of Catholic parochial schools appears to be partially a function of changes in the relative cost of operating those schools. The changes in relative cost were, in turn, primarily driven by the immense sacrificial service contributed by religious sisters (e.g., Burns 1912, 284; Stewart 1994, 327). In strictly financial terms, this sacrificial service can be measured as the difference between the amount of salary received by lay teachers in public schools and the amount of salary-equivalent/stipend received by religious sisters in parochial schools (i.e., the salary forgone, for a lack of better term) multiplied by the number of religious sisters in teaching positions.

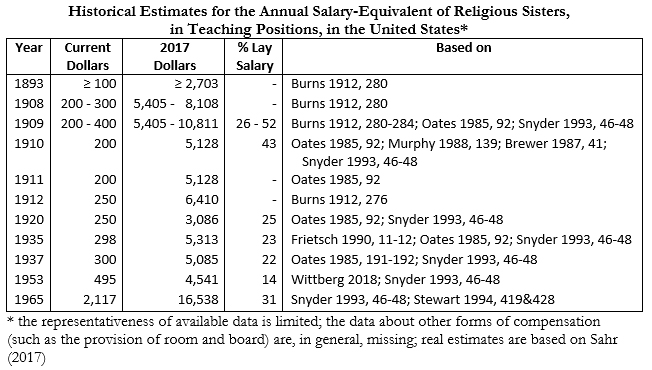
In regard to the first factor, the salary forgone, the table below summarizes available historical estimates for the stipend of religious sisters in teaching positions. In available years, this stipend was roughly one quarter of the salary of lay teachers in public schools. A caveat should be added that this comparison, while illustrative, is severely limited, because it does not account for many differences between the two groups (e.g., value of room and board, educational requirements, average amount of teaching experience, additional sources of income, retirement funding, or cost of living).

It is also important to point out that the sacrifice of the sisters is larger than the ratio might be implying, because a salary’s utility does not change linearly (i.e., reducing the disposable income does not reduce the quality of life as much as reducing the income needed to cover basic expenses). Sisters monetary compensation shown in the table below is so low by today’s standards it is hard to imagine to us today. Notably, it was also hard to imagine in the past. For example, Oates (1985, 184) described a situation where “[e]ven though salaries paid religious brothers were approximately twice those provided sisters for the same work the men found them insufficient.” Stewart (1994, 322, 408) described sisters’ frugality as “extreme” and their wages to be “meager,” and only allowing for “bare subsistence.”


In regard to the second factor lowering the cost of parochial schools, the chart below shows the number of religious sisters in teaching positions. Notably, the highest number of religious sisters in teaching positions was recorded in 1965 when the parochial system was about to reach its all-time high (as described above). However, the number of religious sisters as a percentage of all teachers in parochial schools was already in decline, which might be an indication that the salary cost increase outpaced the system growth. This might have exacerbated the decline beyond what was the result of decreasing number of religious sisters in the following decades.

A caveat should be added here that other reasons also played a role in the decline of the parochial school system. Those reasons include, for example, public school systems catching up with the rapid population growth, the migration of Catholic population from cities to suburbs, and from Northeast to West (thus away from places where parochial schools were established).
 

So, how much of the difference did the religious sisters make? What was their contribution as measured by, so to speak, the amount of forgone salary? In 1965, when the Catholic education system was at its largest, an estimated 103,314 religious sisters held teaching positions (Stewart 1994, 419). In this period, religious sisters received approximately one third of the salaries made by lay teachers in Catholic schools (Hesburgh, Hochwalt, and Shuster 1966) and salaries of lay teachers in Catholic schools were 5 percent to 10 percent lower than salaries of lay teachers in public schools (Koob and Shaw 1970). The annual amount of salary paid to lay teachers in public schools was $6,935 (Snyder 1993, 46-48). Based on those numbers, the sacrificial service of religious sisters teaching in Catholic schools in 1965 alone allowed the Catholic schools to save an estimated $0.5 billion ($3.8 billion in 2017 dollars) relative to public schools.

It is important to point out that those large aggregate amounts are only possible due to daily sacrifices of religious sisters that accrued over a lifetime of teaching work. “[The] phenomenal expansion [of the parochial schools] would have been impossible without sacrificial giving by laity and commitment by the rapidly increasing numbers of sisters who taught without remuneration beyond bare subsistence” (Stewart 1994, 322).

While the attention of those leading the discourse about the needs of the Catholic community in the United States shifts to other, important topics, we may be well advised to remember the extraordinary financial contribution that tens of thousands of sisters made to the Catholic Church each year for decades- as much as $3.8 billion in a single year.

Top image source: Sister Joellen Kohlmann teaching religion at Guardian Angels Central Catholic High School from “Nuns getting harder to find in Catholic schools.” Please read this story for more context to the research presented in this post. Photographer and author of that story: Jerry Guenther, Norfolk Daily News.

8.28.2018

Pain Never Disappears from Unhealed Wounds

As a survey researcher who has studied Catholic reactions to news of allegations of clergy sexual abuse of minors since 2002, I have noticed that there is a detail about the crisis that seems to get distorted at times. In 2012, the last time we asked Catholics about the crisis in a national poll, 21% of adult Catholics could correctly identify that the abuse cases were more common before 1985 than since. The fact that any abuse occurred at all, regardless of when, is horrifying to me and the victims deserve justice and anything that could help them with the damages that resulted from these criminal acts. Yet, this detail is important in understanding the causes of the scandal, what legal actions are possible, and the steps that can be taken to prevent any future abuse.

The authors of the Pennsylvania grand jury report were careful to note that, “We know that the bulk of the discussion in this report concerns events that occurred before the early 2000’s” (p. 6). At the same time they correctly note that abuse “has not yet disappeared” and there are a couple of more recent allegations detailed in their findings. As they note, “Many of the priests who we profile here are dead” (p. 12). Dates for birth, year of ordination, and death are not available for all the accused in the report (some are seminarians or brothers and were never ordained). Forty-four percent of the accused in the report are known to be dead (five were born in the 19th century). Their average age at death was 73. Among the accused who are still alive or presumed alive, the average age today is 71. Priests accused of abuse in the Pennsylvania grand jury report, on average, were born in 1933 and ordained as priests in 1961. Outside of Pennsylvania, allegations of abuse have also been levied recently against former Cardinal Theodore McCarrick. He was similarly born in 1930 and ordained a priest in 1958. 

There is something to this generational pattern and this finding was first uncovered in the scientific study of the abuse crisis in 2004 by researchers at the John Jay College of Criminal Justice. They noted in 2004, “The majority of men in this study were born between 1920 and 1950 and were ordained in their mid- to late-twenties.” The most common decade of birth for alleged abusers was the 1930s and the most common decade of ordination was the 1960s. This profile has not changed in allegations that emerged in the 14 years that have followed—including the recent grand jury report. No new wave of abuse has emerged in the United States.


The clergy sex abuse scandal unfolding in the news today is the same public scandal that erupted with national media reports in 2002 (beginning in Boston). It is likely, but no one can be sure, that the cases in the grand jury report have already been present in existing allegation totals (reports to the John Jay researchers are cited as a source for information about allegations in the grand jury report). Just as then, the abuse in the headlines most often occurred in the 1960s through the 1980s.

What is revealed new in the grand jury report is a level of detail that previous investigations have not often included. The authors report on a “playbook” that Church leaders allegedly used to handle allegations of clergy sex abuse in the state prior to 2002. “It seemed as if there was a script. Through the end of the 20th century, the dioceses developed consistent strategies for hiding child sex abuse” (p. 297). This strategy included the use of euphemisms in documentation that minimized abuse as conduct that was “inappropriate” or related to “boundary issues.” The dioceses’ investigations appeared to be deficient or biased, according to the grand jury. Many accused priests were sent for treatment in a clinical approach to the abuse rather than what should have occurred—criminal reporting. Once these treatments were considered complete, abusers were often returned to ministry in new assignments. The allegations were rarely, if ever, disclosed publicly. Victims rarely received the care they needed, let alone justice. The grand jury concludes that, “The repeating pattern of the bishops’ behavior left us with no doubt that, even decades ago, the church understood that the problem was prevalent” (p. 300). Further, “The bishops weren’t just aware of what was going on; they were immersed in it. And they went to great lengths to keep it secret. The secrecy helped spread the disease” (p. 300).

This strategy is not entirely dissimilar to the responses of other institutions when faced with any accusations of sexual abuse of minors whether it has been scouting groups, public schools, prep schools, universities, or in youth athletics. These types of institutions seem to attract sexual abusers of minors who seek positions of trust and respect with access to young people. The the John Jay researchers noted in 2011, “Sexual victimization of children is a serious and pervasive issue in society. It is present in families, and it is not uncommon in institutions where adults form mentoring and nurturing relationships with adolescents, including schools and religious, sports, and social organizations” (p.5).

The Church failed in responding to accusations of abuse and more often chose to cover up the criminal activity than disclose and report it. The Church in some cases sought non-disclosure agreements in civil settlements with victims—a practice that the grand jury believes should be abolished. What was often different in the Church than elsewhere, especially prior to 2000, was the clinical response to abuse—sending abusers for treatment and allowing them to return to ministry after this was completed. These were grave errors in judgment. This allowed abusers the potential to return to work and continue to abuse. It also ignored the legal obligation to seek justice for crimes committed.

That playbook, to the degree it was used broadly, appears to have changed in 2002. The report authors note, “On the whole, the 2002 [Dallas] Charter did move things in the right direction” and that “external forces have also generated much of the change” (p. 302). They note concern that the Church’s 2002 Dallas Charter still leaves too much of the decision making to diocesan bishops. The external changes brought by mandated abuse reporter laws, longer statutes of limitations, and increased public awareness have created a new reality. They write, “Today we sense some progress is made” (p. 303) often by actors external to the Church rather than from within it.  

Have new allegations of abuse declined as a result? The John Jay researchers aggregated the number of allegations of clergy sexual abuse of minors from 1950 to 2002. Their study included allegations made by 10,667 individuals. CARA has collected the numbers of new allegations of sexual abuse by clergy since 2004. CARA’s studies, through 2017, include 8,694 allegations. The distribution of cases reported to CARA are nearly identical to the distribution of cases, over time, in John Jay’s results. We know the year that each alleged abuse began for 8,206 cases. For 488, this is not known. The figure below shows the cases where we can place these in time.


New abuse allegations have not disappeared. In the last three years, 22 allegations of abuse occurring during 2015-2017 have been made. This is an average of about seven per year nationwide in the Church. That is far too many. Nothing is acceptable other than zero. At the same time, to put those reports in some context, 42 teachers in the state of Pennsylvania, where the grand jury reported from, lost their licenses to educate for sexual misconduct in 2017. As recently as 2015, 65 teachers in the Los Angeles Unified School District (LAUSD) were in “teacher jail” for accusations of sexual abuse or harassment in that county alone. The current wave of “educator sexual misconduct” has yet to receive the same aggregation and attention that clergy sexual abuse has by the media (although The Washington Post has rung a warning bell and Carol Shakeshaft has written extensively on it in academic work). As the John Jay researchers note, “No other institution has undertaken a public study of sexual abuse and, as a result, there are no comparable data to those collected and reported by the Catholic Church” (p. 5).

“It is happening in other institutions” is by no means any sort of excuse and that is not what is intended by referring to these realities. Instead, these other cases provide a context, which becomes important when someone who reads news of abuse occurring decades ago in churches in Pennsylvania decides to attack a priest today in Indiana or when a parent feels their children will be less safe in a Catholic school than a public school. It also points to the dangers of thinking that incidents of sexual abuse are unique to Catholic institutions.

As the grand jury report authors note, the Church has changed in the last 15 years. But you cannot “fix” the past nor can it be erased. This won’t all fade away. It’s nothing that can ever be outrun. You have to deal with it. The Church did not sufficiently do so in 2002 and the years that followed. Creating new policies to prevent future abuse are not a sufficient response to the legacy of what happened. Now, in 2018, it is time to lift the veil of any secrecy that remains. If not, the same cases will emerge again and again as if these were a wound that scabs but never heals. Every time that scab is removed it will bleed again and again. As painful as it is now, it is the time to deal with this great injury the Church brought upon itself. If anything, the re-emergence of these cases again and again should reveal that this wound has potentially deadly consequences if it is not dealt with completely once and for all.


Update 8/29: Some reactions to this post have asked about the impact of known delays in reporting by victims. There has been no substantial shifting forward in time of the alleged abuse trend between 2002 and 2017. The accusations continue to fit the historical pattern. We’d expect the trend to move forward in the last 15 years if reporting delays were evident but this has not been the case. No new wave of allegations similar to the past has occurred to date. It is also likely that most, if not all, the Pennsylvania cases are already in existing reported accusation totals.

Update 8/30: We continue to hear feedback about the delays in reporting related to the age of the victim. The data regarding accusations in the Catholic Church specifically appear to be much more event-driven than age-driven. Rather than victims reaching a certain age and coming forward, it has more often been the case that abuse being in the news that has led victims to come forward in large numbers. The figure below is from the John Jay research (p. 9) and shows when allegations were reported up to 2002. One can see the spike in the 1990s after a series of cases in the news and again in a larger magnitude in 2002 in the wake of news of abuse cases in Boston. Since 2004, new allegations have averaged 618 per year (438 in 2017). Regardless of when reports are made, the accusations often fit the existing pattern described above for when the abuse occurred. Four allegations of abuse occurring in 2017 were made in 2017.


5.17.2018

Is It Healthy to be Catholic?


Religion and health are a thing. There is even a journal devoted to the topic. The correlations between being religious and being in good health are numerous (extensive meta-analysis here). Religious people are less likely to smoke and more likely to exercise than non-religious people. Religious people eat healthier diets and have lower blood cholesterol levels than the non-religious. Yet, those healthier diets and more exercise have not led religious people to necessarily have lower body weights, on average, than the non-religious. Healthier lifestyles of religious Americans do appear though to impact heart health and blood pressure relative to the outcomes of non-religious people in the country. The religious also have higher functioning immune and endocrine systems, on average. Religious Americans are even less likely to get cancer than the non-religious and when they do get a diagnosis they often have a better prognosis for recovery. All of this leads to a rather surprising conclusion:

“The most impressive research on the relationship between R/S [religion and/or spirituality] and physical health is in the area of mortality. ... At least 121 studies have examined relationships between R/S and mortality. … Considering the 63 methodologically most rigorous studies (quality ratings of 8 or higher), 47 (75%) found R/S predicting greater longevity (two at trend level), whereas three (5%) reported shorter longevity. Another systematic review and two meta-analyses have confirmed this relationship between R/S and longer survival. The effects have been particularly strong for frequency of attendance at religious services in these three reviews. Survival among frequent attendees was increased on average by 37%, 43%, and 30% (mean effect being 37% across these reviews). An increased survival of 37% is highly significant and equivalent to the effects of cholesterol lowering drugs or exercise-based cardiac rehabilitation after myocardial infarction on survival.”
–Harold G. Koenig, M.D., Duke University, “Religion, Spirituality, and Health: The Research and Clinical Implications”

The potential pathways for these outcomes are numerous. Religious people tend to be members of religious communities and these offer support in a variety of ways. Being religious may also reduce stress and have other positive psychological benefits that are related to physical health outcomes. Religious people, on average, also appear to be less likely than non-religious people to engage in behaviors that come with increased health risks.

But how healthy is Catholicism? According to the General Social Survey (GSS) the average Catholic adult male is 5 feet 8 inches and weighs 189 pounds. The average adult female is 5 feet 4 inches and weighs 158 pounds. Body Mass Index (BMI) combines this information into a single number that indicates whether one is underweight, normal weight, overweight, or obese. The average Catholic adult has a BMI of 27.2. This is lower than people of other affiliations. Overall, 36% of adult Catholics are of a normal weight (a small percentage are underweight). About four in ten are overweight and about a quarter are obese. Again, these numbers are generally better than those of other religious affiliations and similar to those with no religious affiliation (“None” are also disproportionately younger with an average age of 40.6 compared to 47.7 for Catholics and 50.5 for other Christians). As existing research shows, the GSS confirms that religion and spirituality are not linked to lower weights. However, among the religious, Catholics appear to be the least likely to be obese.

Most Catholics say they are in excellent or good health and are more likely to say this is excellent than those of other religious affiliations. Those without an affiliation are just as likely to say they are in excellent health. There is a relationship between one’s BMI and their self-reported health. Americans of a normal weight are most likely to report being in excellent or good health. Those who are overweight are less likely to do so and those who are obese are least likely to self-report this.


Catholics are less likely than those of other religious affiliations to report they have ever been diagnosed with high blood pressure, arthritis, depression, or diabetes. Those without a religious affiliation have a similar health profile to Catholics with an additional reduced risk of arthritis (again likely related to average age differences). Here again, with each illness, the higher your BMI, the more likely you are to have had a diagnosis. Thirty-eight percent of obese adults have been diagnosed with high blood pressure compared to 13% of those with normal weights. Twenty-two percent of obese respondents indicated they had a diagnosis of arthritis compared to 10% of those with normal weights. Fifteen percent of the obese have diagnosed diabetes compared to 4% of those with normal weights. Even depression is slightly more common among adults with obesity than those with normal weights (18% compared to 13%).


Thirty-eight percent of those with normal weights report that they are very happy (an additional 55% are pretty happy). Only 28% of those with obesity say they are very happy (61% say they are pretty happy). Christians in America, whether they are Catholic, Protestant, or some other affiliation, are more likely than those of other religious affiliations or no affiliation to say they are very happy.


While the GSS offers only one snapshot for these questions it is a remarkable one in that Catholics appear to be among the healthiest of Americans in body and mind. We can assume spiritual health likely correlates well with these aspects. The GSS does show that Catholics who attend Mass more frequently are more likely than infrequent attenders to say they are very happy.


Overall differences in health between Catholics and others are small but consistently positive. While no one should be writing prescriptions for Catholic baptisms yet it does appear that there are certainly no ill health effects from being a member of the faith in the United States. 

Update: I had a reader ask about running regressions and I took a look with OLS and Logit (where appropriate) to test the findings further. Catholics, controlling for age, gender, and years of education have a lower BMI (by 0.83) than non-Catholics (p = .03). Catholics are also less likely than non-Catholics to have been diagnosed with hypertension (p = .01). Note that non-Catholics includes those with religious affiliations and those without a religious affiliation. The relationships between Catholicism and self-reported health, arthritis, depression, and diabetes do not achieve statistical significance controlling for these other factors. More highly specified models may reveal more but it is safe to say two important health factors, BMI and hypertension, passed regression analysis with standard controls. There is indeed something more here to explore...

Doctor photo courtesy of Alex Proimos.

Search This Blog

Blog Archive

© 2009-2026 CARA, Mark M. Gray. Background image courtesy of muohace_dc.