As 2024 comes to an end, we can announce that CARA celebrated its 60th birthday. Looking back this year went well beyond the last 365 days…
In the 1950s and 1960s there were calls from within the Catholic Church for a national social science research center so the Church could better understand and navigate a rapidly changing society. That center was created on August 5, 1964. The Center for Applied Research in the Apostolate’s honorary first president Richard Cardinal Cushing provided a $50,000 start-up grant (the equivalent of more than $500,000 today). Founding board members included Archbishop John Cody and Archbishop Fulton Sheen.
For more about this period of CARA's history see Francis X. Gannon's article in Review of Religious Research at JSTOR (subscription required) called Bridging the Research Gap: CARA, response to Vatican II.
Upon announcing CARA’s creation, Archbishop Cody said, “Up
to the present, there has been in this country no mechanism capable of aiding
an integrated apostolic effort supported by careful study, evaluation and
scientific research. CARA will represent a serious attempt to fill this need in
a thoroughly professional and scientific manner.”
Since this time, CARA has had three major dimensions to its mission:
- to increase the Church’s self-understanding
- to serve the applied research needs of Church decision-makers and to,
- to advance scholarly research on religion, particularly Catholicism.
CARA has never been a “think tank” and has instead focused on being a high-quality research source who provides data for decision makers without commentary or editorial. In our 60 years we have produced more than 2,400 research studies for Catholic organizations large and small.
Initially, CARA was located near the Catholic University of America. Over time we have moved west across Washington DC to its current home near Georgetown University.
During its earliest years in the 1960s and into the 1970s, the center focused on broad questions facing the Church and employed a team of more than 30 researchers from 20 different religious institutes. For a time in the 1970s, in addition to research, CARA operated a conference center with facilities for sleeping and dining in a building owned by the center near the Catholic University of America. During this period CARA’s research was focused on questions about leadership, diocesan and parish management and administration, Catholic education and healthcare, as well as vocations and formation for priesthood and religious life.
In the 1980s, CARA’s reach took on an international focus for a time. The center also saw CARA organizations and offices start-up in Los Angeles, Canada, and Rome. During this period, CARA was also tasked with managing the first wave of the World Values Survey in the Americas (including polls in Argentina, Canada, Mexico, and the United States). Today, this is one of the longest running global studies of cultural values.
From the mid-1980s and into the 1990s, CARA had sold its business property and began to downsize its staff and seek a new operating model by affiliating with Georgetown University. This provided improved financial stability. During this period, CARA was primarily doing contract projects for dioceses and religious congregations, and strengthened its commitment to two operating principles: developing a reputation for high-quality on-time research services and ensuring all costs of staff and facilities were covered by revenues from research projects.
For more about this period of CARA's history, when it celebrated its 20th year, see Dolores Liptak's article in U.S. Catholic Historian at JSTOR (subscription required) called The Center for Applied Research in the Apostolate (CARA): 1964-1984.
In the 1990s, CARA also regularly issued the CARA Seminary Directory and the CARA Formation Directory of Men and Women Religious, among other publications. With the assistance of a grant from the Lilly Endowment, 1987 began the biennial publication of the CARA Catholic Ministry Formation Directory, with sections on all U.S. priesthood, diaconate, and lay ecclesial ministry programs. This study now reports statistics annually with directories published every other year. Given the growing shortage of priests, CARA also at this time developed its Priest Projection Program, which since that time has completed clergy forecasts for numerous dioceses. In 1989, CARA moved to offices near many other Georgetown University entities.
In the late 1990s and into the 2000s, CARA introduced several new research initiatives that have stood the test of time to the benefit of CARA’s institutional reputation and financial stability. Among these was its individually-tailored parish in-pew survey program, which was initially funded by a grant from Our Sunday Visitor Institute and has now been used by more than one thousand parishes nationwide.
In 2000, CARA began producing the map of U.S. CatholicDioceses published annually in The Official Catholic Directory. That same year, CARA introduced its CARA Catholic Poll, a national public opinion poll of Catholic adults.
Another major event was the introduction of The CARA Report, a quarterly research newsletter now beginning its 30th year, whose subscribers include offices of the USCCB, many Catholic dioceses, parishes, educational institutions, organizations, institutes of men and religious, and individual subscribers. Its wide distribution, with summaries of recent CARA research, continues to result in frequent mentions of CARA’s survey results and other projects in both religious and secular news media.
During this period, CARA continued to provide specially designed research services for its national clientele, principally dioceses, religious institutes, and major Catholic organizations such as Catholic Charities USA and the National Catholic Educational Association.
The continuing high quality of its research projects solidified relationships within the U.S. Conference of Catholic Bishops, resulting in annual reports on each year’s priestly ordination class, both new entrants and permanent professions in institutes of women and men religious, the state of the permanent diaconate, and incidents of clergy sexual abuse of minors. The overall result of these annual data collection efforts is that CARA has, in effect, become the official definitive source for a variety of vocation-related and other Church statistics.
Related to the above, in this internet era, CARA embraced the concept of having both on-site and off-site research staff who work cooperatively together as needed to complete research projects. CARA now has four on-site researchers, including two vowed religious, all with doctoral degrees. Off-site staff include laity, priests, and vowed religious, all with advanced academic degrees.
This wealth of scholarly talent has had two particularly beneficial results: One is the active participation of CARA scholars in the annual joint conferences of the Society for the Scientific Study of Religion and the Religious Research Association, at which they present scholarly papers and presentations on their latest research projects. The other is a succession of CARA-produced books and articles published by the secular and religious press.
Now in the 2020s, CARA has continued to conduct client-based research for many Catholic dioceses and religious institutes and a wide variety of national Catholic organizations, as well as the previously described series of annual reports and specialized studies for the USCCB. Another recent development has been the strengthening of research relationships with other academic institutions such as The Catholic University of America and the McGrath Institute for Church Life at the University of Notre Dame.
In recent years, CARA has begun to return to something for which it was formed six decades ago—service to an international missionary Church. As has been the practice throughout its history, CARA adjusted to new realities by focusing on the present-day needs of the Church—in this country and across the world.
In 2016, in cooperation with the African Sisters Education Collaborative (ASEC), and the support of the Conrad N. Hilton Foundation, CARA introduced the CARA Visiting Scholars Program, by which women religious from Africa, South Asia, and Latin America come to CARA for a six-month period to develop their skills in applied research. Over this period, each sister works on CARA projects and develops her own research agenda. On return to her home country, each sister completes several applied research projects that serve the needs of religious in her nation.
In collaboration with the Catholic nonprofit Save Our Aging Religious (SOAR!), and the cooperation of the leadership conferences of both women and men religious, CARA also recently undertook a series of studies and presentations investigating solutions to the problem of inadequate funding and care for the large number of elderly religious sisters in the United States. With support from the Conrad N. Hilton Foundation, CARA then conveyed important lessons learned about planning for the care of elderly and infirm sisters to religious communities in other countries, first in Africa and more recently in Asia and Latin America.
CARA now looks forward to the future with our original mission still in mind, informed by decades of research, data, and experience to draw on.
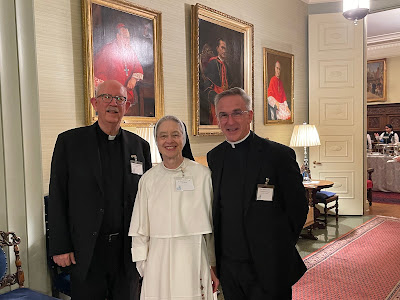
We paused to celebrate these 60 years in November 2024. The event was at the Apostolic Nunciature of the Holy See in Washington, DC. Here we honored Diocese of Tucson Bishop Emeritus Gerald Kicanas, who served as CARA’s board chair from 2006 to 2015, with the Cardinal Cushing Medal for Advancement in Church Research. Three organizations were presented with the Rev. Louis J. Luzbetak, SVD Award for Exemplary Church Research: CERRA-Africa, Desarrollo y Salud Integral de las Religiosas en México, and the Centre for Research on Religious Life India.
Some photos from that event are below.


.JPG)


